Onvertz → Insights & Reporting
Insights & Reporting · the numbers core
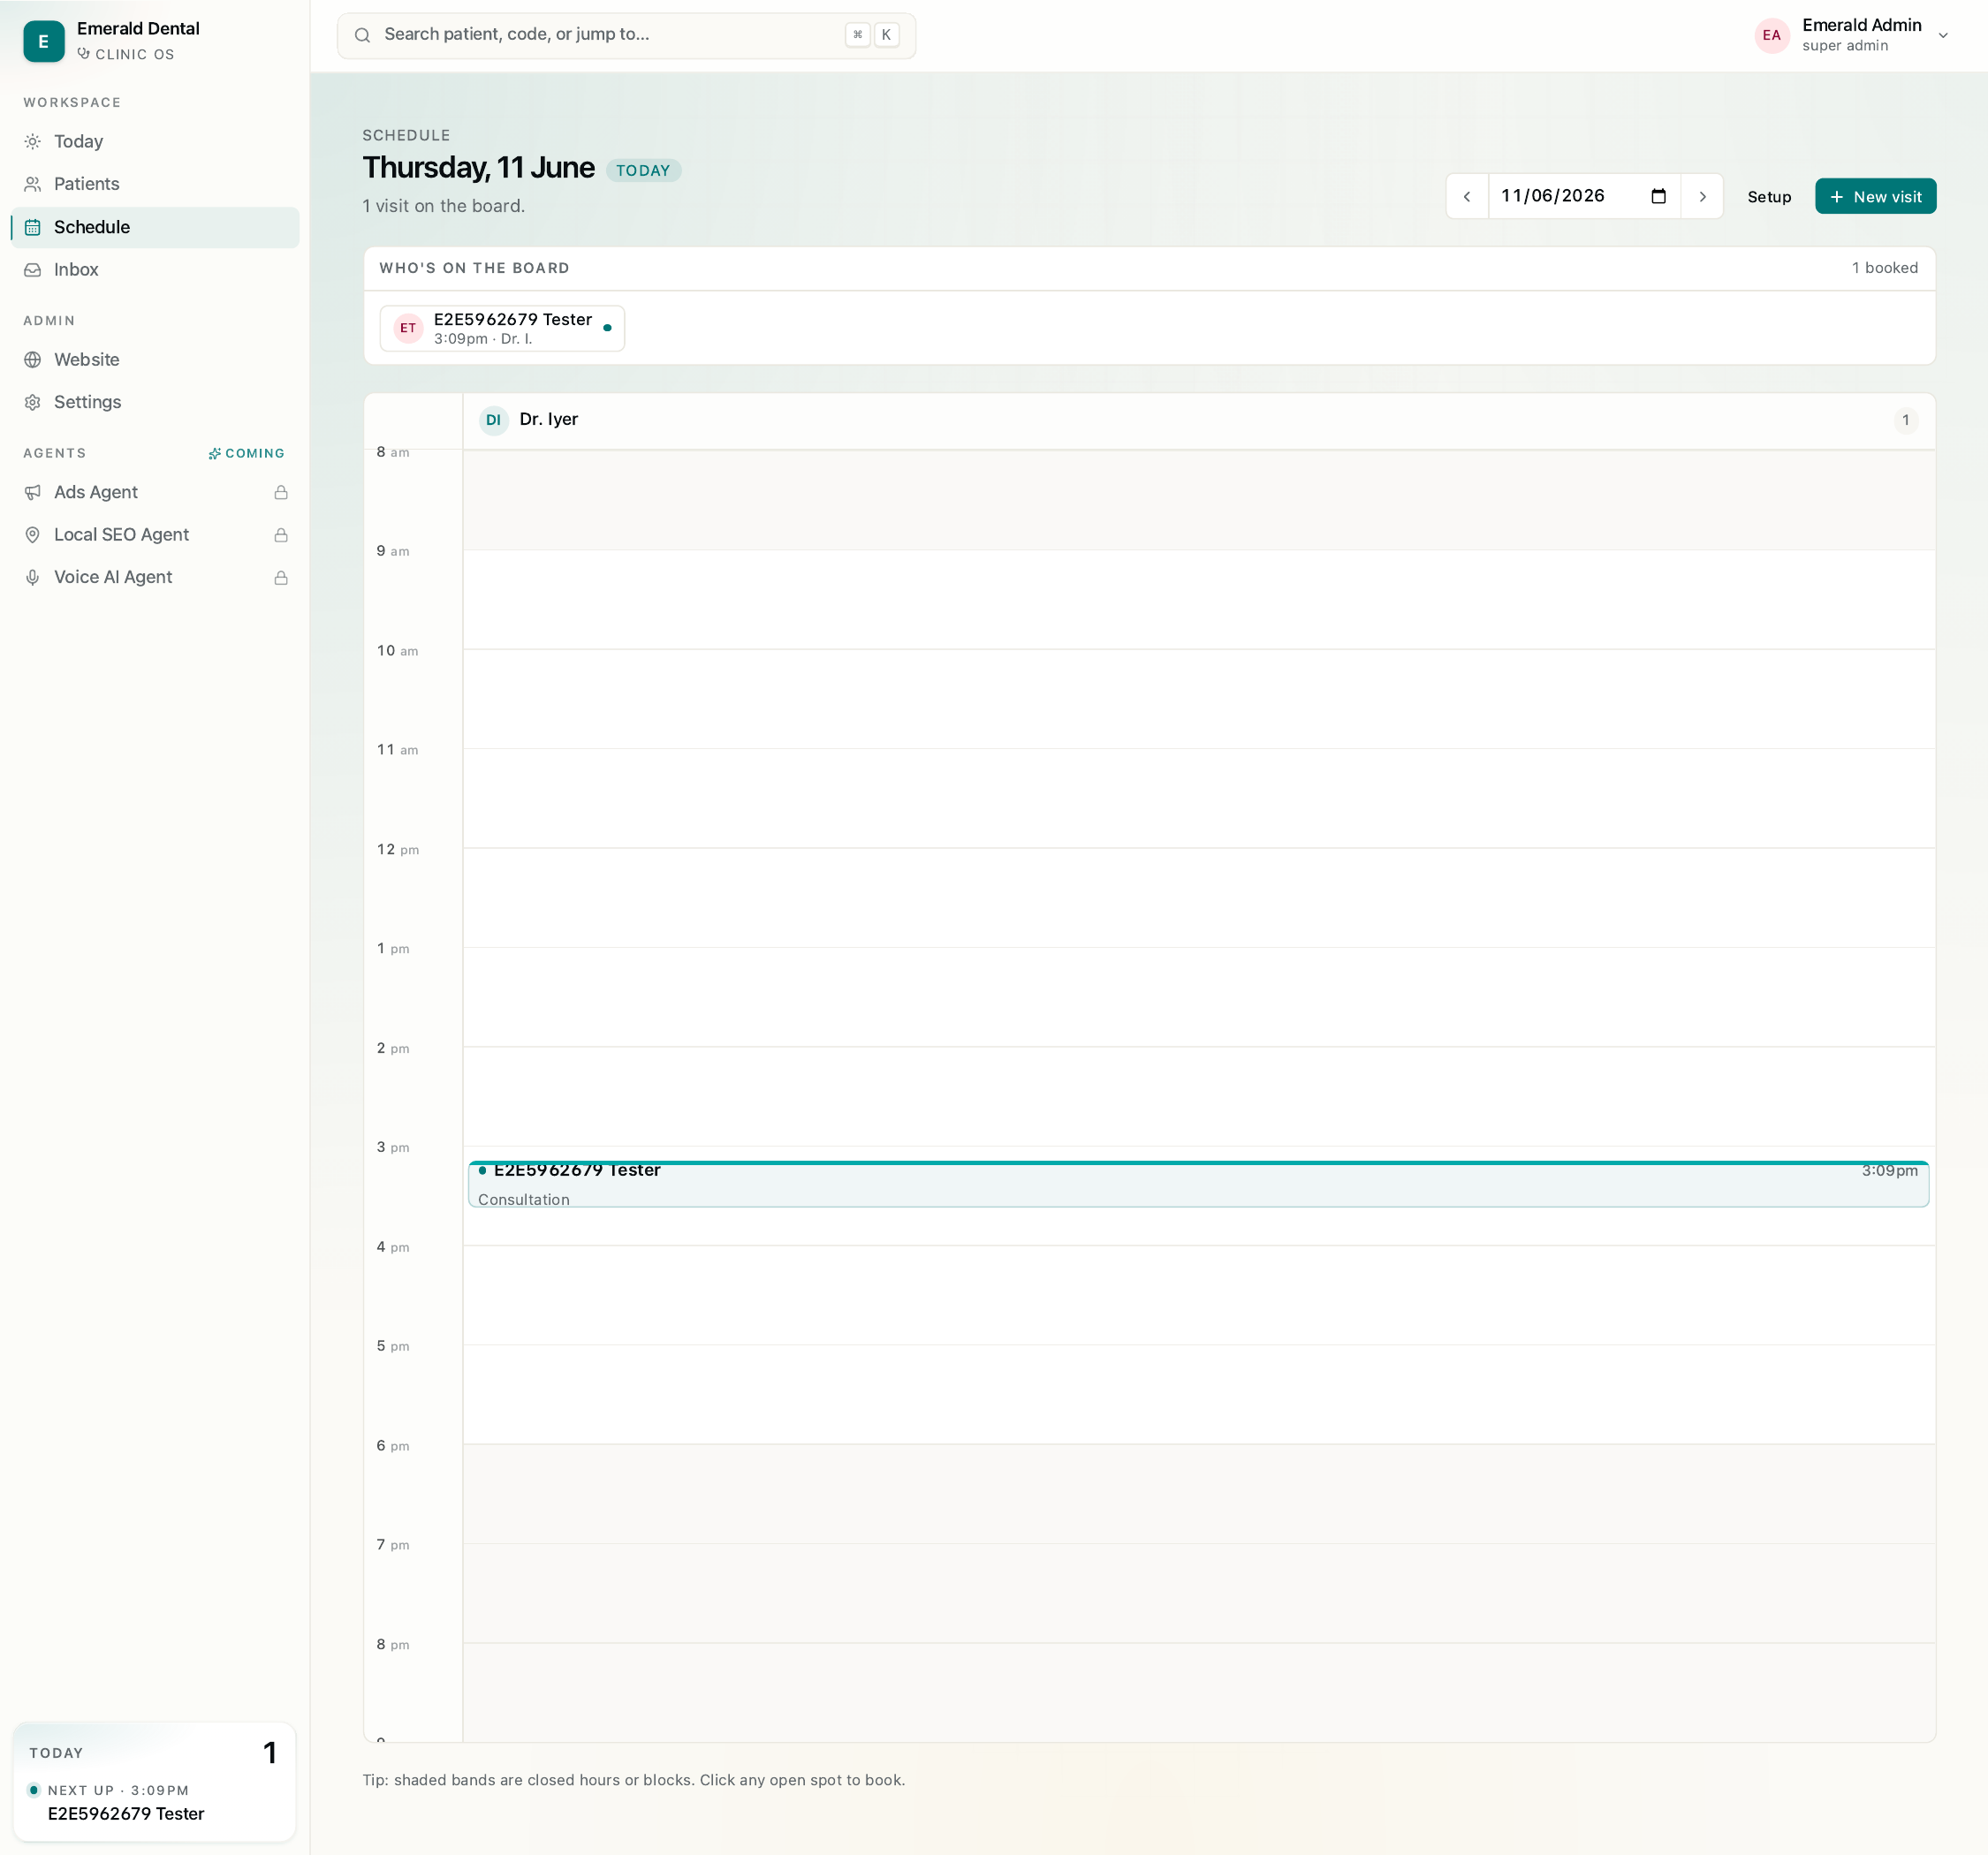
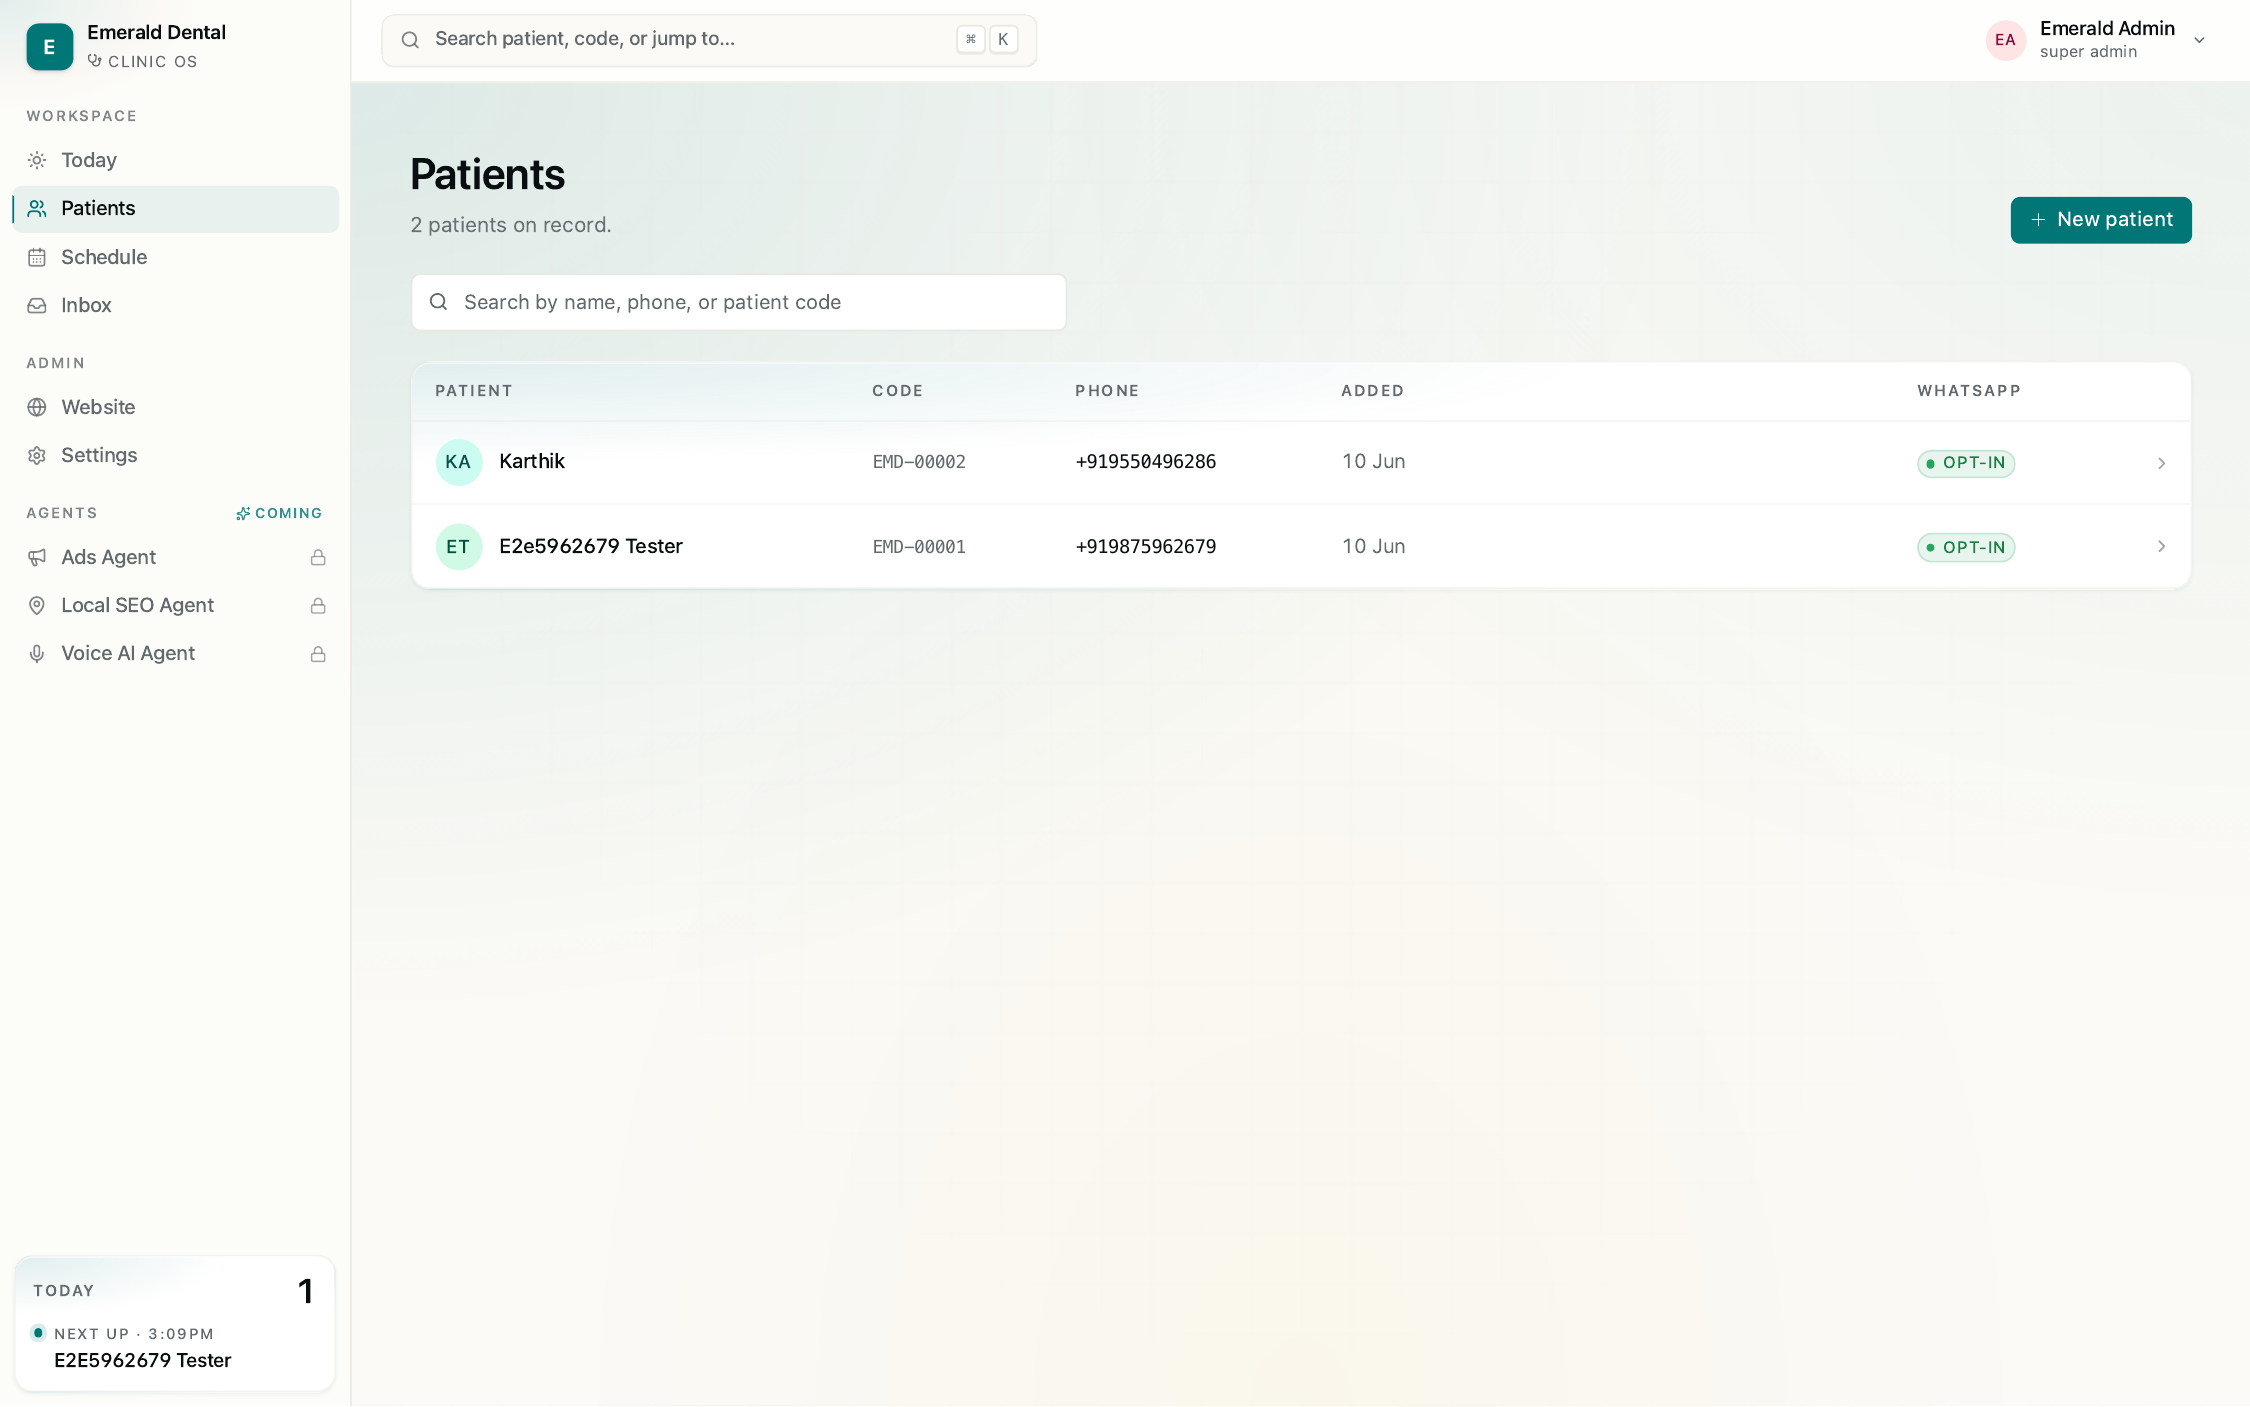
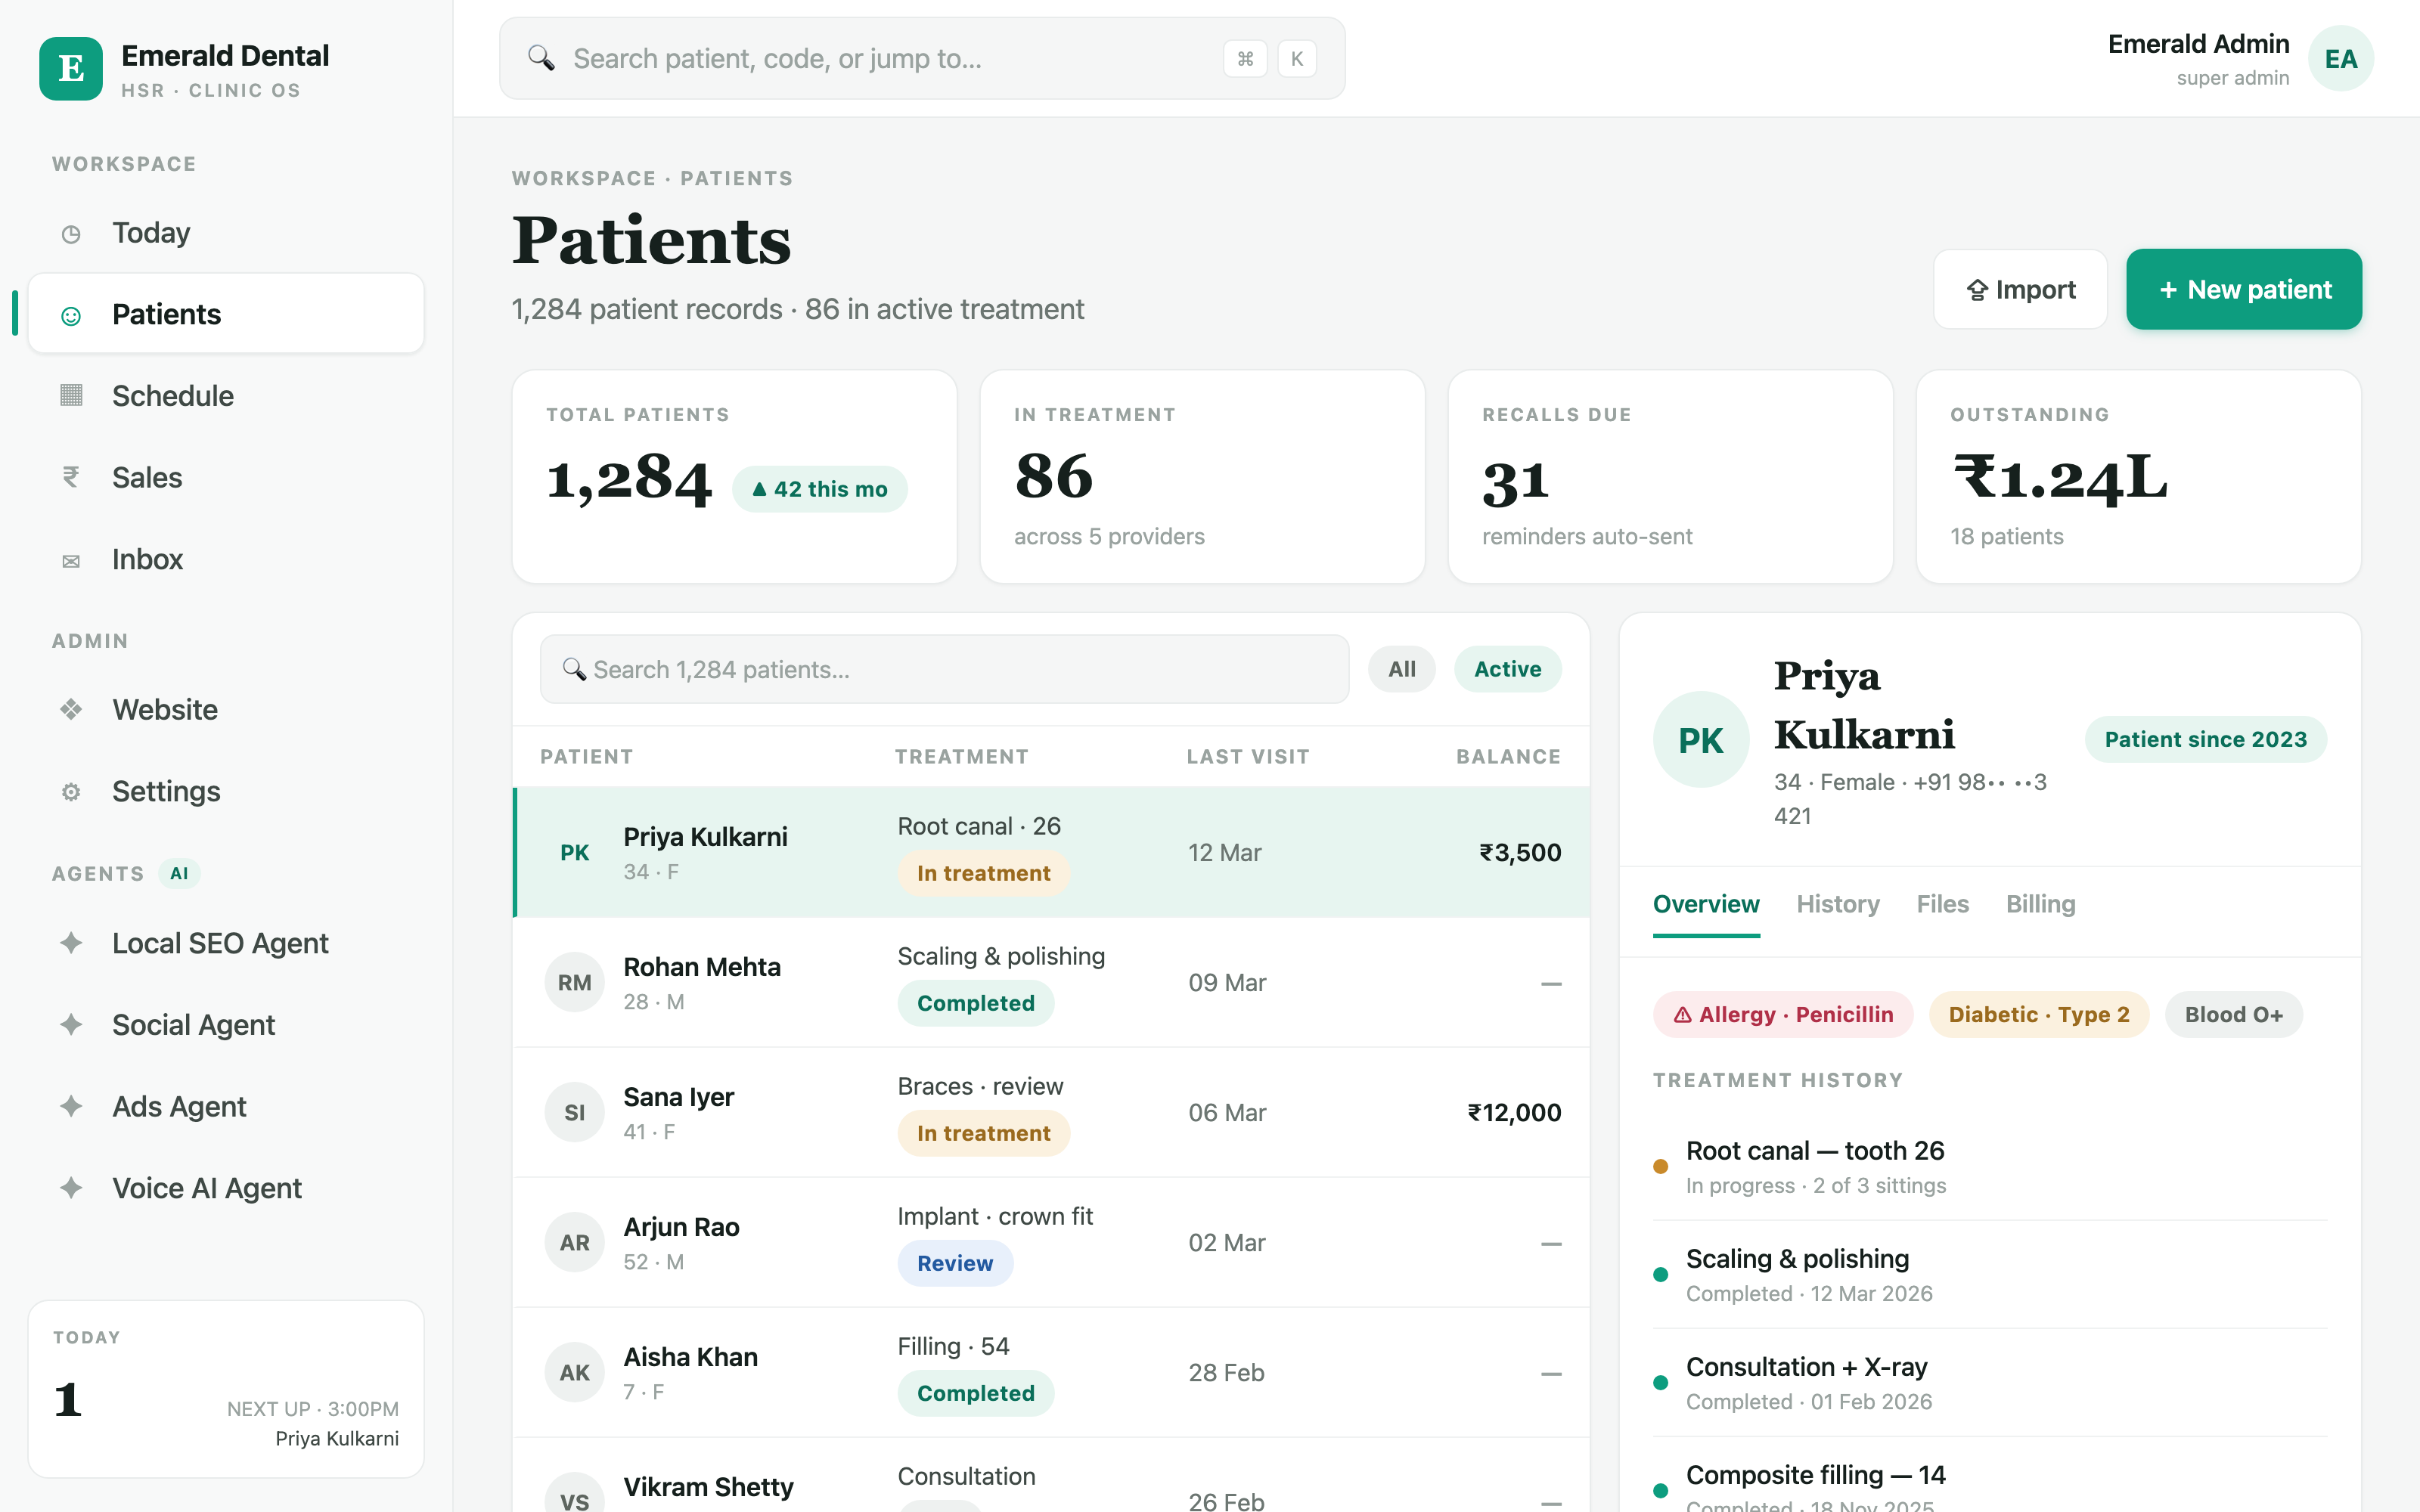
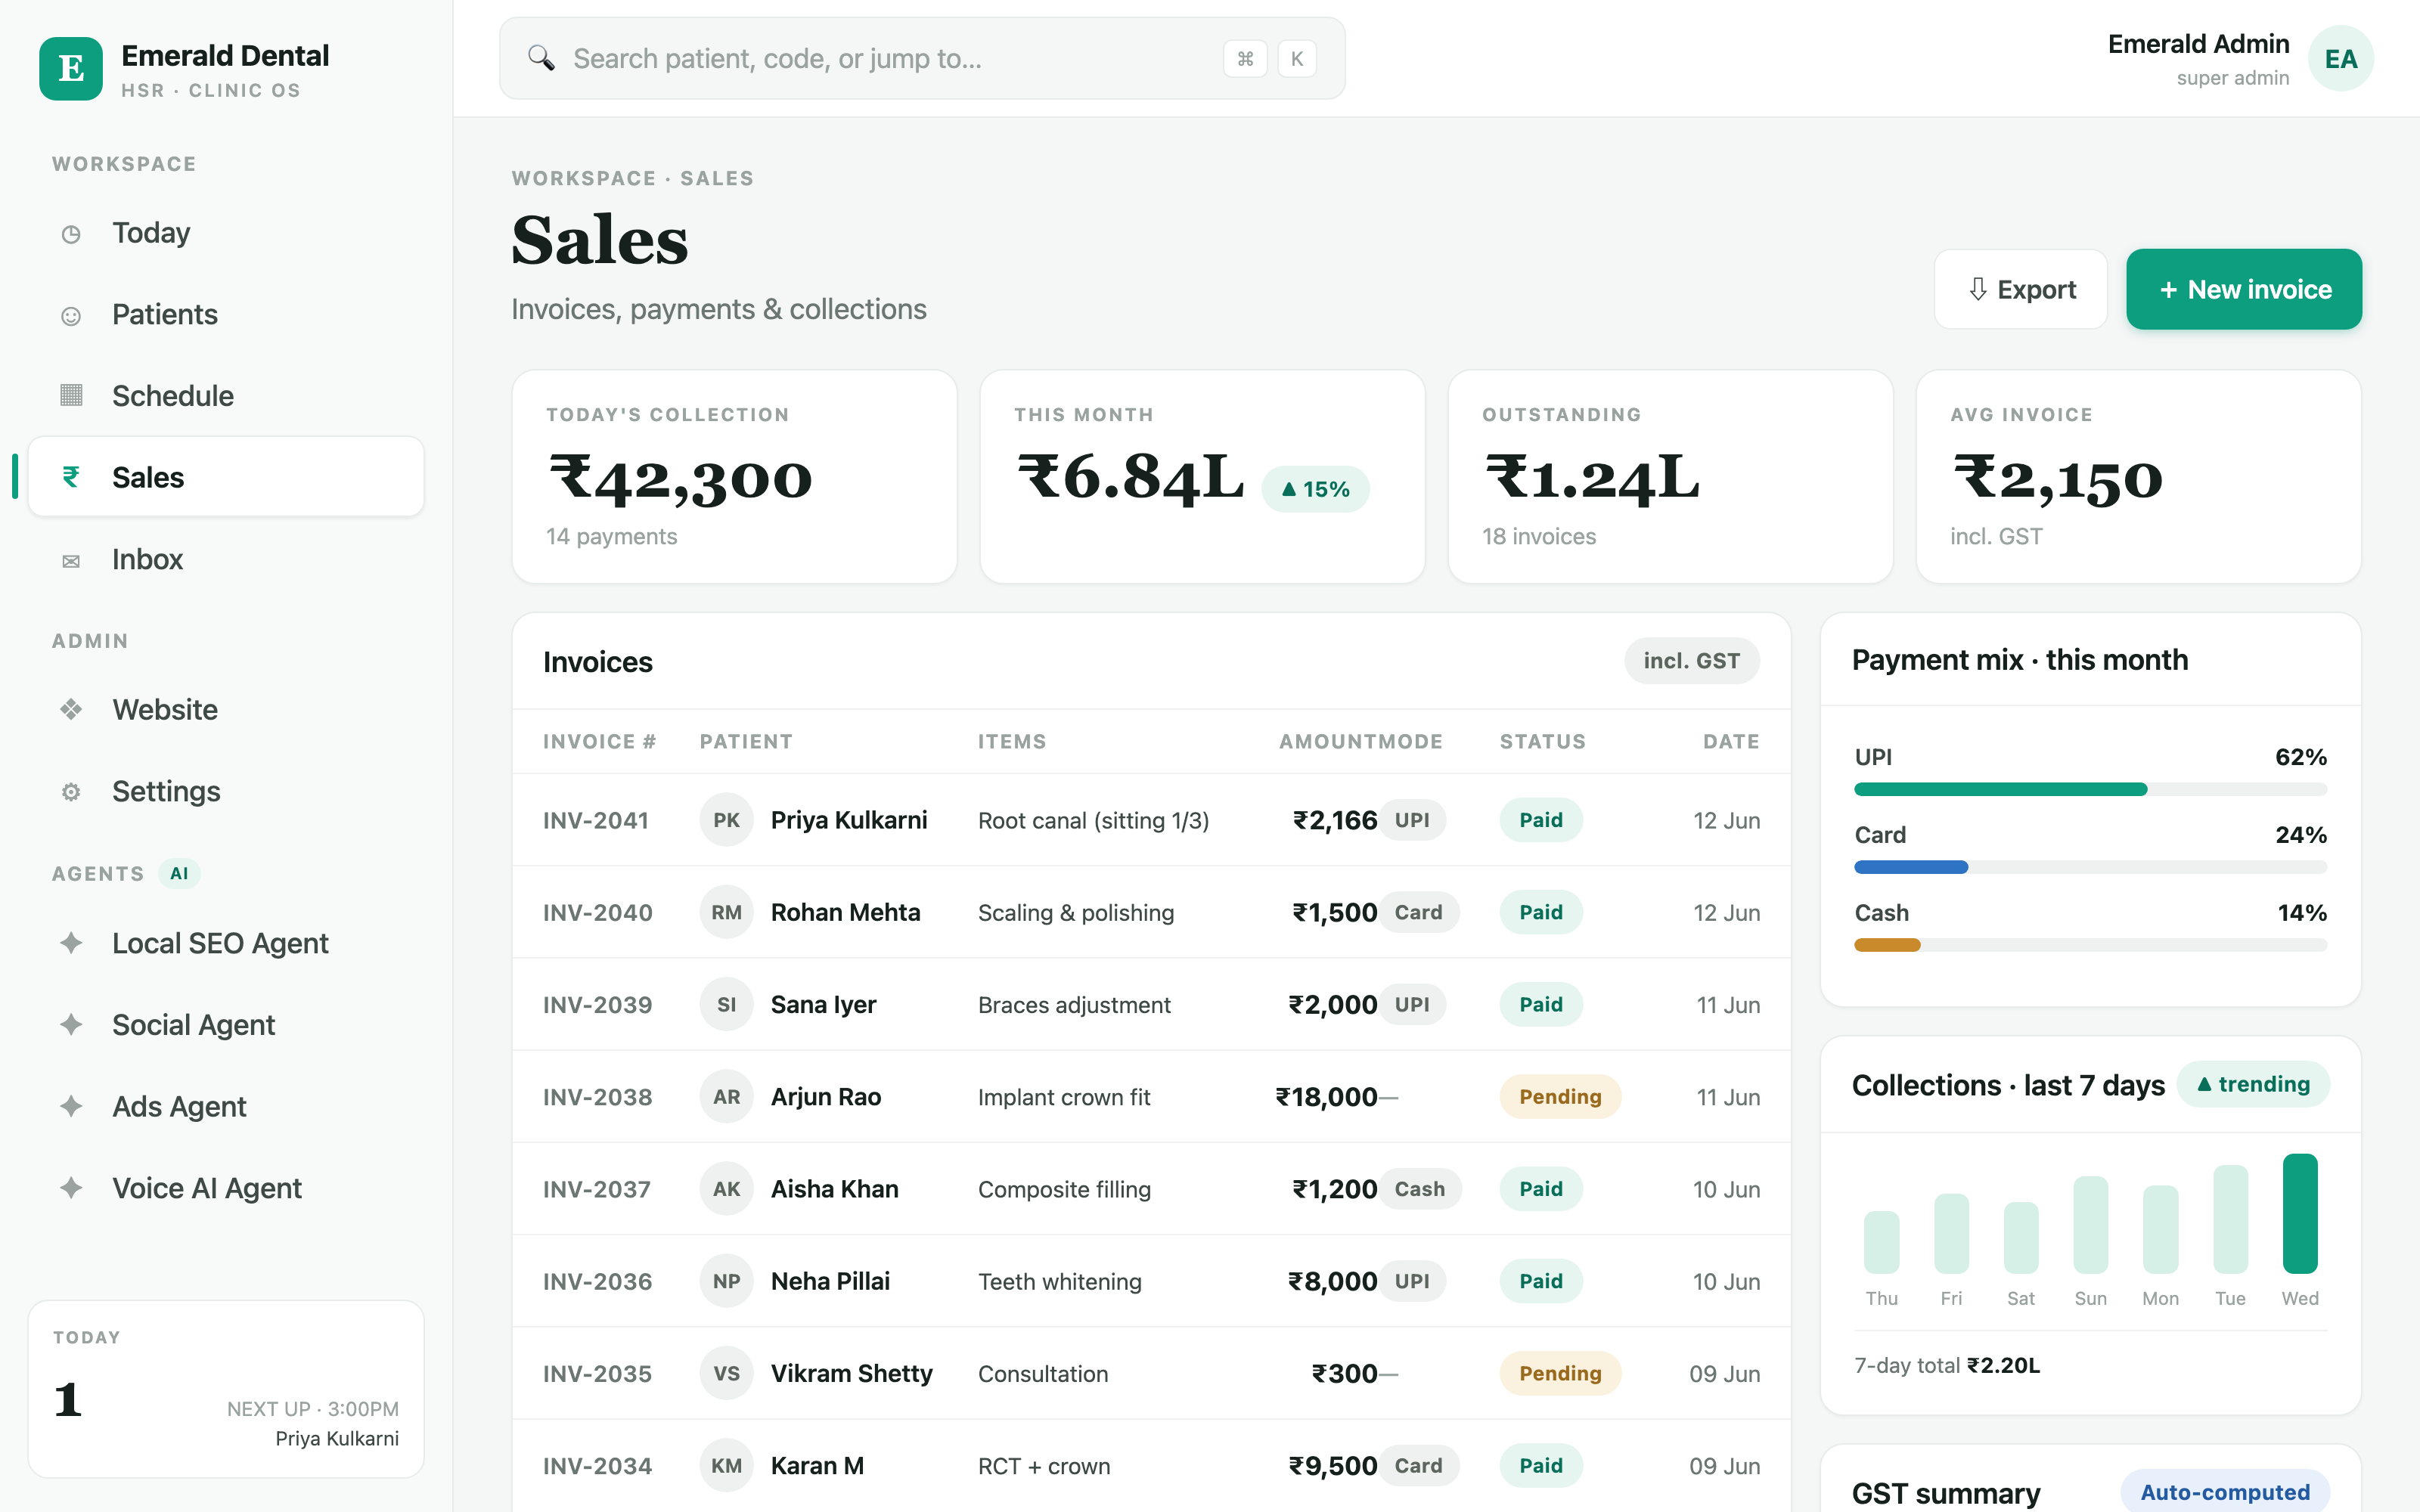
Right now it's the Google dashboard, the ads manager, a spreadsheet of screenshots and a monthly guess. Log in to Onvertz and all of it lives on one screen — profile views, searches, calls, directions, clicks, ad spend, conversions and ROAS, read by you, in the app — so you know what's working without stitching five tools together. Every location gets its own report, and the rollup shows the whole business at a glance.
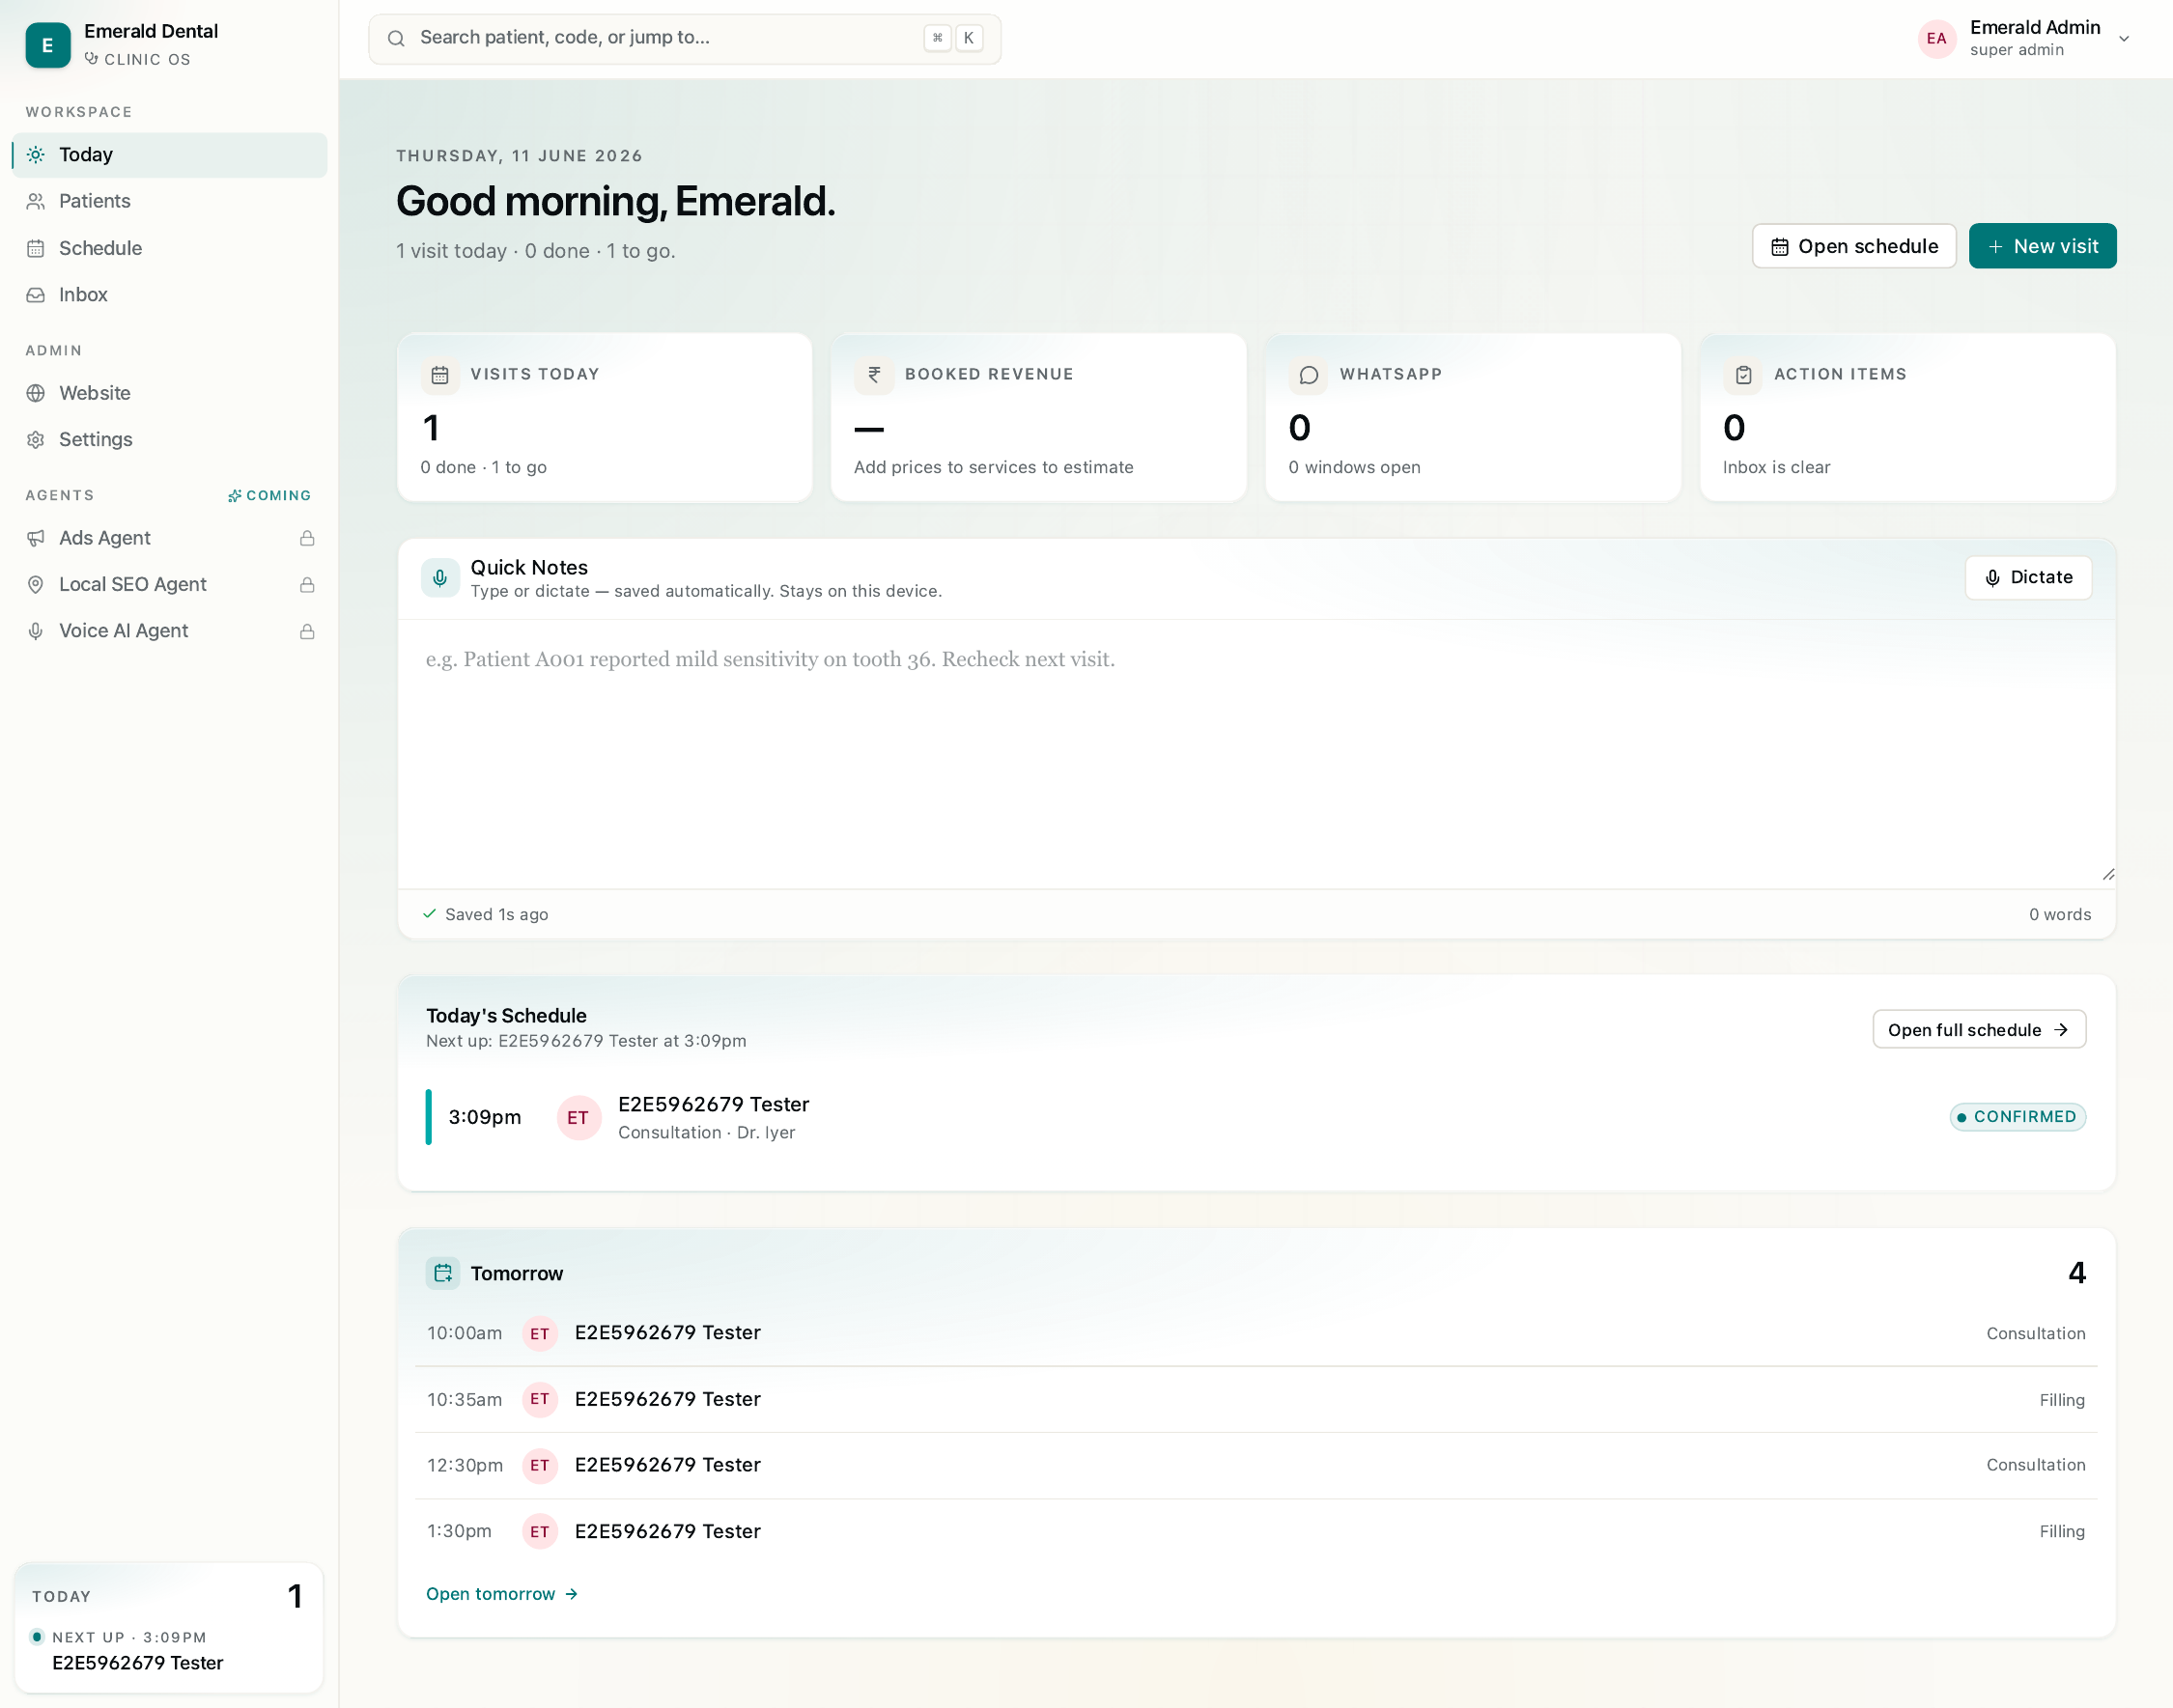
The chaos you've learned to live with
Calls nobody counted. A drop in profile views nobody noticed. Ad spend reconciled from screenshots at 9pm. A location's whole month living in a tab you have to go find. None of it is broken because you don't care — it's broken because the numbers are scattered across five places that don't talk to each other.
the whole picture — views, searches, calls, spend, conversions — not five dashboards you toggle between.
reports go out on their own — weekly, monthly, per location — so "I'll compile it later" stops being a reason for flying blind.
AI watches the numbers for you — a dip in calls, a spike in searches, an ad bleeding budget — and flags it before it costs a month.
What's included
Not an analytics tool you have to figure out. The reporting core of your business: see how customers find you, what they do next, what your ads return, and what changed — without leaving the screen.
How many people saw you, what they searched to find you, and how that's trending — pulled up in two taps, not dug out of a Google dashboard.
Every call, direction request and website click your profiles produce, counted — so the actions that become customers finally get tracked.
Spend, leads and return across Google & Meta, reconciled automatically — so what your ads earned isn't a guess at month end.
One report per location, and a rollup across the whole business, side by side — so the branch that's slipping doesn't hide behind the one that's flying.
Weekly and monthly reports land on email or WhatsApp automatically — bringing the numbers to you without anyone compiling them.
No tab-switching, no copy-pasting between tools, no retraining. You open one screen and the whole month is already there.
What you can actually do
Six modules, one login. Here is the breadth of what Insights & Reporting handles for a local business — from the first profile view of the month, to the report that lands on your WhatsApp on Monday morning.
Real screens, not mockups
No artist's impression. These are live screens from Onvertz — the metrics board you review your month from, and the location report that opens in two taps.

Views, searches, calls and clicks — every location and every metric in one glance.

Views, calls, spend and trend — searchable, never stuck in a screenshot folder.
The whole picture, working
Inside the dashboard
The real Locations and Reports screens inside Onvertz — every location's numbers, and every campaign reconciled to ROAS.

Locations · views, calls & trend, two taps away

Reports · spend, conversions & ROAS, auto-reconciled
See a real month on one screen
On the demo we'll walk you through a live dashboard for a business like yours — pull up profile views, trace a call back to the search that caused it, check a campaign's ROAS, open a location report — so you can see the whole month flow through one screen, and click around yourself. No slides. No price talk. Just your actual numbers, clearer.
No pricing page. On purpose.
We'll walk you through a live dashboard built around a business like yours — locations, channels, campaigns — and let you click around yourself. Either you see how much clearer the month gets and come aboard, or you walk away with a sharper picture of where your growth leaks. No commitment.